
- Overview
- Guides
- Concepts
- Considerations And Constraints
- Absolute File References
- Assembly Colocation Assumptions
- Concurrent Use Of Test Resources
- Cross Application Domain Testing
- Heavily Executed Code Under Test
- Implicit File Dependencies
- Multi Threaded Tests
- Netstandard Test Projects
- Project Atomicity
- Project Build Platform And Configuration
- Rdi Data Point Location
- Test Atomicity
- Unique Test Names
- Using NCrunch With Source Control
- Reference
- Global Configuration
- Overview
- Auto Adjust Clashing Marker Colours
- Build Log Verbosity
- Build Process Memory Limit
- Capabilities Of This Computer
- Control Cores Used For Test Execution
- Coverage Marker Style
- Cpu Cores Assigned To NCrunch Or Ide
- Custom Environment Variables
- Disable Global Hotkey
- Engine Hosting Strategy
- Fast Lane Threads
- Fast Lane Threshold
- Grid Maximum Reconnection Attempts
- Grid Reconnection Delay
- Impact Detection Mode
- Listening Port
- Log To Output Window
- Logging Verbosity
- Marker Colours
- Max Failing Test Trace Log Size
- Max Number Of Processing Threads
- Max Passing Test Trace Log Size
- Max Test Runners To Pool
- NCrunch Tool Window Colors
- Node Id (Name)
- Password
- Performance Aggregation Type
- Performance Display Sensitivity
- Pipeline Optimisation Priority
- Rdi Storage Settings
- Sliding Build Delay
- Snapshot Storage Directory
- Solution Storage Data Limit
- Spinner Colours
- Terminate Test Runners On Complete
- Test Process Memory Limit
- Tests To Execute On This Machine
- Text Output Font
- Workspace Base Path
- Solution Configuration
- Overview
- Additional Files For Grid Processing
- Additional Files To Include
- Allow Parallel Test Execution
- Allow Tests In Parallel With Themselves
- Infer Project References Using Assembly
- Instrumentation Mode
- NCrunch Cache Storage Path
- Only Consider Tests Outofdate If Impacted
- Project Config File Storage Path
- Show Coverage For Tests
- Show Metrics For Tests
- Tests To Execute Automatically
- Project Configuration
- Overview
- Additional Files To Include
- Allow Dynamic Code Contract Checks
- Allow Static Code Contract Checks
- Analyse Line Execution Times
- Autodetect Nuget Build Dependencies
- Build Priority
- Build Process Cpu Architecture
- Build Sdk
- Collect Control Flow During Execution
- Consider Inconclusive Tests As Passing
- Copied Project Dependencies
- Copy Referenced Assemblies To Workspace
- Custom Build Properties
- Data Storage File Size
- Default Test Timeout
- Detect Stack Overflow
- Enable Rdi
- Files Excluded From Auto Build
- Framework Utilisation Types
- Ignore This Component Completely
- Implicit Project Dependencies
- Include Static References In Workspace
- Instrument Output Assembly
- Method Data Limit
- Ms Test Thread Apartment State
- Preload Assembly References
- Prevent Signing Of Assembly
- Proxy Process File Path
- Rdi Cache Size
- Required Capabilities
- Restrict Tostring Usage
- Run Pre Or Post Build Events
- String Length Limit
- Track File Dependencies
- Use Build Configuration
- Use Build Platform
- Use Cpu Architecture
- Runtime Framework
- Overview
- Atomic Attribute
- Category Attribute
- Collect Control Flow Attribute
- Distribute By Capabilities
- Duplicate By Dimensions
- Enable Rdi Attribute
- Environment Class
- Exclusively Uses Attribute
- Inclusively Uses Attribute
- Isolated Attribute
- Method Data Limit Attribute
- Requires Capability Attribute
- Restrict Tostring Attribute
- Serial Attribute
- String Length Limit Attribute
- Timeout Attribute
- Uses Threads Attribute
- Global Configuration
- Troubleshooting
- Tools
- Keyboard Shortcuts
- Manual Installation Instructions
Quick Start Guide
Installation
If you haven't already, first go and download an installer for the IDE you are working with.
There are separate installers for all supported versions of Visual Studio. Installing NCrunch for one version of Visual Studio should have no impact on other versions you may have running on your machine.
When working in JetBrains Rider, NCrunch is installed using the plugin options inside the IDE (rather than through an installer).
Once you've downloaded and installed NCrunch, it should be ready to go. Note that if you had your IDE open during the installation, you'll need to restart it before NCrunch will load.
First Time Run
For your first run with NCrunch, it's often a good idea to try it out with a small, well tested solution that you understand well. This should give you a bit more space to get your head around how the background processing works. NCrunch also works very well with large solutions, but often requires a bit more configuration to reach the best possible experience.
By default, NCrunch will always start as disabled for a solution before it is explicitly turned on from the top menu.
Once you've opened up your solution, select Enable from the NCrunch extension menu in your IDE. NCrunch should wake up and show a wizard to help you configure it for your machine, and the solution you're working in. It's worth stepping through this wizard and answering the questions, as this will save you from needing to configure the individual settings yourself.
After running through the wizard, you can get a handle on what's going on under the hood by opening up the Processing Queue from the top menu. This should open up a dockable tool window that shows the inner workings of the NCrunch engine.
The processing queue is a useful way to get detailed information about the background processing, such as finding out which tests are being run, how the work is prioritised, etc. You could consider it your 'what is going on?' view that you can check any time while you work.
If all is well, you should have a nice long list of blue ticks down the side of the queue by the time the engine has finished its first run. If you have any red crosses, possibly this means you are using some kind of custom build configuration that will need some investigation. Have a look at troubleshooting project build issues for more information on how to fix situations like this.
During its first full build and test cycle, NCrunch will keep track of the execution times of tests within your solution along with details about the build dependencies between your classes. It will then use this information to optimise future test cycles to give feedback as fast as possible.
Analysing Test Results
Now that you've cleared a full cycle of data from the engine, it's time to make sense of it. The processing queue will show some summary details about the tests that ran in each of the tasks processed by the engine, but this isn't an ideal way to find out what actually happened. So it's now time to close the processing queue and instead open up the Tests window from the top menu.
The Tests Window is a useful window to keep open while you're developing. It provides immediate feedback on all relevant output from the engine (including failed builds and failing tests). It will also give some information about which tests/builds are being run at a particular point in time (watch out for the clock icons).
Depending on the state of your solution and how you've engineered your tests, you may see some failures here. NCrunch does everything it can to run your automated tests in the same way as you usually would, but sometimes tests are programmed with certain environmental considerations that NCrunch isn't aware of. If you have any test failures that don't look right to you, have a look at troubleshooting test issues.
Working With Code Coverage
So... now we know what's going on under the hood, and we can see the results that come from it, including inline code coverage and performance metrics.
As part of it's build process, NCrunch will automatically instrument your source code and perform code coverage analysis while processing your tests. The analysis is language agnostic and shouldn't interfere with your runtime code.
When you have a look through some of your classes known to be covered by your tests, you should see a line of coloured circles (markers) stretching down the left margin. These markers indicate test code coverage for their adjacent lines of code.
The default colouring of these markers is explained below:
![]() Green marker: Line is covered by passing tests
Green marker: Line is covered by passing tests
![]() Red marker: Line is covered, but by at least one failing test
Red marker: Line is covered, but by at least one failing test
![]() Black marker: No tests are covering this line (feel the fear!!!)
Black marker: No tests are covering this line (feel the fear!!!)
![]() Hot Spot marker: Line is covered by tests but executes slowly
Hot Spot marker: Line is covered by tests but executes slowly
The markers will fade out when they are indicating coverage for tests that haven't been run against the latest version of your source code.
Note that you can also change these colours at any time. It's also possible to change the marker shapes.
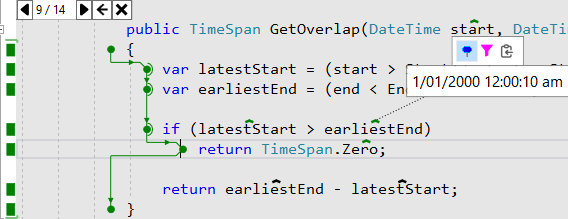
Where exception stack traces are available for your tests, these will be projected over the markers as a series of red Xs showing where the exceptions were raised.
At any time you can hover the mouse over a marker for tooltip information on the number of tests covering the line, exception details, etc. You can also click on a marker to access a popup menu showing all covering tests. Double-clicking a test in the popup will navigate the IDE to the first line of the test in its fixture. You can right-click on a marker for a context menu providing more options.
The constant on-the-fly analysis of your test coverage allows NCrunch to maintain up-to-date mappings between the code coverage and your source code. These mappings are retained across multiple test cycles and always find their way back to the line of code they relate to. This means that it's possible for the engine to kick off a long running test for 20 minutes, then still be able to make constructive use of the code coverage returned by the test when it completes - even if you made several code changes while the test was executing.
If you have regions of code that you don't want NCrunch to analyse (for whatever reason), you can also tell NCrunch not to instrument them by using special inline comments.
Daily Use
As a concurrent test runner, it's recommended that you let NCrunch take responsibility for the day-to-day running of suitable tests. You can use the inline code coverage to help give you immediate feedback on tests you may be working on, along with providing details on which parts of your codebase are safe to touch.
If (for whatever reason) you want to retain control over when the tests are run, you can set the engine to run tests manually through the NCrunch->Set Engine Mode sub-menu. Note that NCrunch will automatically perform background builds while in manual mode, and will continue to prioritise test execution based on your changes, so kicking off the tests manually will still likely give you feedback much faster than a normal test runner.
You can shut the engine off at any time by clicking Disable in the top menu.
If the engine gets into any trouble (and you think the results may not be an accurate reflection of your source code), you can also use the Reset button on the toolbar of the Tests Window - this is effectively the same as disabling and re-enabling the engine, clearing all state and recycling.
Once you're comfortable with how the engine works, know that you've only just scratched the surface of what is possible with NCrunch. You should have a look at optimising its performance and using it for integration testing.
NCrunch does also have a runtime framework, with attributes that can be used to control how your tests are executed. If you are introducing NCrunch to a complex solution, these attributes are worth becoming familiar with.
Runtime Data Inspection
Once NCrunch is running your tests successfully, it's time to get started using Runtime Data Inspection ('RDI').
RDI captures values and detailed control flow from test execution runs, then lets you analyse this in the IDE with overlays that can be opened with a single click. It greatly reduces your reliance on the debugger, and opens up new kinds of analysis that would otherwise be impossible.
Check out our RDI guide for getting starting with this powerful feature.
