- Overview
- Guides
- Concepts
- Considerations And Constraints
- Absolute File References
- Assembly Colocation Assumptions
- Concurrent Use Of Test Resources
- Cross Application Domain Testing
- Heavily Executed Code Under Test
- Implicit File Dependencies
- Multi Threaded Tests
- Netstandard Test Projects
- Project Atomicity
- Project Build Platform And Configuration
- Rdi Data Point Location
- Test Atomicity
- Unique Test Names
- Using NCrunch With Source Control
- Reference
- Global Configuration
- Overview
- Auto Adjust Clashing Marker Colours
- Build Log Verbosity
- Build Process Memory Limit
- Capabilities Of This Computer
- Control Cores Used For Test Execution
- Coverage Marker Style
- Cpu Cores Assigned To NCrunch Or Ide
- Custom Environment Variables
- Disable Global Hotkey
- Engine Hosting Strategy
- Fast Lane Threads
- Fast Lane Threshold
- Grid Maximum Reconnection Attempts
- Grid Reconnection Delay
- Impact Detection Mode
- Listening Port
- Log To Output Window
- Logging Verbosity
- Marker Colours
- Max Failing Test Trace Log Size
- Max Number Of Processing Threads
- Max Passing Test Trace Log Size
- Max Test Runners To Pool
- NCrunch Tool Window Colors
- Node Id (Name)
- Password
- Performance Aggregation Type
- Performance Display Sensitivity
- Pipeline Optimisation Priority
- Rdi Storage Settings
- Sliding Build Delay
- Snapshot Storage Directory
- Solution Storage Data Limit
- Spinner Colours
- Terminate Test Runners On Complete
- Test Process Memory Limit
- Tests To Execute On This Machine
- Text Output Font
- Workspace Base Path
- Solution Configuration
- Overview
- Additional Files For Grid Processing
- Additional Files To Include
- Allow Parallel Test Execution
- Allow Tests In Parallel With Themselves
- Infer Project References Using Assembly
- Instrumentation Mode
- NCrunch Cache Storage Path
- Only Consider Tests Outofdate If Impacted
- Project Config File Storage Path
- Show Coverage For Tests
- Show Metrics For Tests
- Tests To Execute Automatically
- Project Configuration
- Overview
- Additional Files To Include
- Allow Dynamic Code Contract Checks
- Allow Static Code Contract Checks
- Analyse Line Execution Times
- Autodetect Nuget Build Dependencies
- Build Priority
- Build Process Cpu Architecture
- Build Sdk
- Collect Control Flow During Execution
- Consider Inconclusive Tests As Passing
- Copied Project Dependencies
- Copy Referenced Assemblies To Workspace
- Custom Build Properties
- Data Storage File Size
- Default Test Timeout
- Detect Stack Overflow
- Enable Rdi
- Files Excluded From Auto Build
- Framework Utilisation Types
- Ignore This Component Completely
- Implicit Project Dependencies
- Include Static References In Workspace
- Instrument Output Assembly
- Method Data Limit
- Ms Test Thread Apartment State
- Preload Assembly References
- Prevent Signing Of Assembly
- Proxy Process File Path
- Rdi Cache Size
- Required Capabilities
- Restrict Tostring Usage
- Run Pre Or Post Build Events
- String Length Limit
- Track File Dependencies
- Use Build Configuration
- Use Build Platform
- Use Cpu Architecture
- Runtime Framework
- Overview
- Atomic Attribute
- Category Attribute
- Collect Control Flow Attribute
- Distribute By Capabilities
- Duplicate By Dimensions
- Enable Rdi Attribute
- Environment Class
- Exclusively Uses Attribute
- Inclusively Uses Attribute
- Isolated Attribute
- Method Data Limit Attribute
- Requires Capability Attribute
- Restrict Tostring Attribute
- Serial Attribute
- String Length Limit Attribute
- Timeout Attribute
- Uses Threads Attribute
- Global Configuration
- Troubleshooting
- Tools
- Keyboard Shortcuts
- Manual Installation Instructions
Runtime Data Inspection (RDI)
NCrunch Runtime Data Inspection ('RDI') is a real-time analysis system that brings runtime data values and detailed code control flow inline into the IDE.
RDI offers an extremely powerful way to quickly view and understand the behaviour of code without any need for a debugger. Where with a debugger we step through code line-by-line and examine the state of process memory, RDI instead captures a massive volume of data from a test execution run, then lets you interrogate and sift through this data long after the test run has completed. RDI projects this data over the top of your source code, so you can easily see values read from variables, fields and parameters, along with the entire flow of execution control through every method included in the dataset.
RDI differs somewhat from other analysis features in NCrunch. NCrunch's other features involve runtime data being passively collected and passively shown. RDI passively collects data but it is available only through active interrogation. This means that even though the data may be present and available, you won't see it unless you specifically open an overlay to view it.
RDI is the result of 15 years of R&D and is reliant on the entirety of NCrunch's infrastructure. It acts as a system built atop the other components of NCrunch, and is enabled via config setting.
Accessing RDI
For RDI to be accessible, your solution must be fully built by NCrunch with the enable RDI config setting enabled. RDI storage settings must also be configured. The NCrunch setup wizard can guide you through these settings.
Note that RDI does have constraints and limitations. It is recommended that you read the entirety of this guide before using it for the first time on a large and/or complex solution.
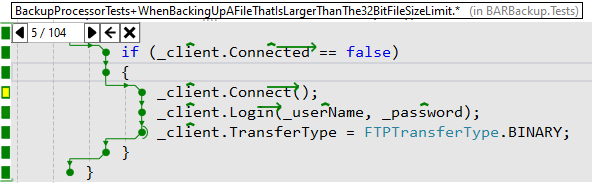
When RDI is active, you will see brackets appear around the NCrunch coverage markers on the left side of the editor in your IDE.
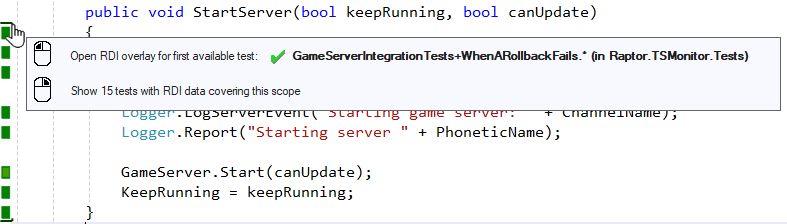
Left clicking on an opening or closing bracket will open the RDI overlay. All significant features of RDI are accessed from this overlay.
The overlay can also be opened via context menu or shortcut key (default is 'Control+M, Y').
Features of RDI
Collection of Method Control Flow
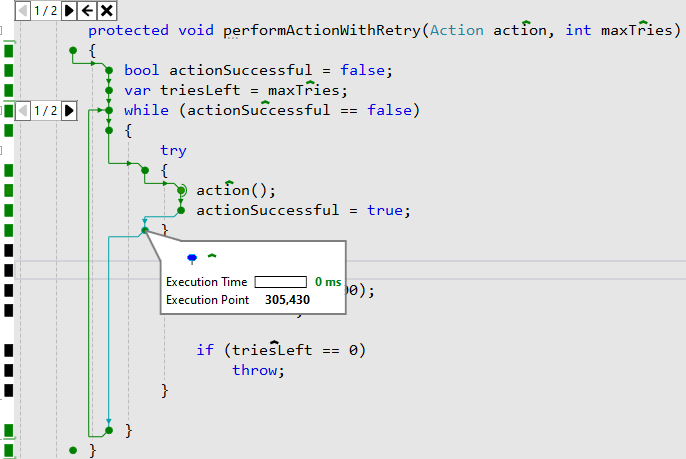
RDI collects the path of execution through every method. This includes handling for things like conditions, loops, switches and even goto statements. The execution path is projected inside the overlay with arrows showing the behaviour. Loops are captured inside sub-frames that can be enumerated to show every stage of the loop.
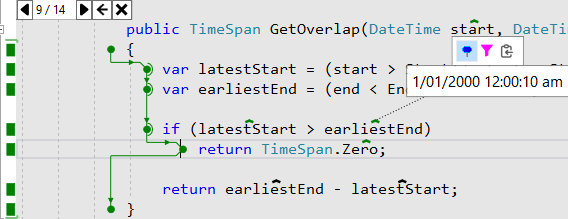
Collection of Accessed Data
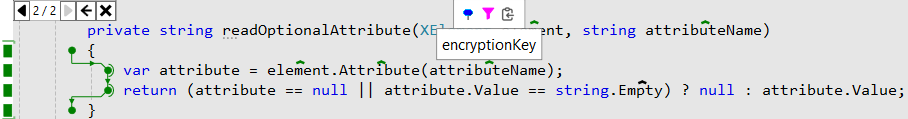
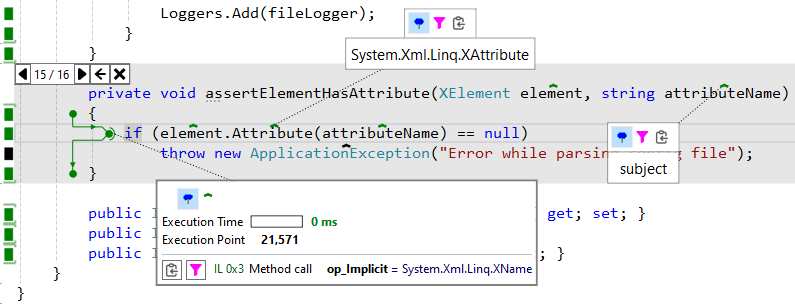
When a variable, field, parameter or method return result is accessed by code, RDI will take a copy of the value and capture it. This is done carefully to avoid disturbing the normal function of code. This data is then available in the RDI overlay. You can view it by hovering your mouse over a marker sitting atop the relevant code element.
Detected data points that couldn't be matched reliably with text in the source line are available by hovering your mouse over the control flow markers. Control flow markers that contain these data points can be identified by an extra nib on the right side of the marker.
Navigation
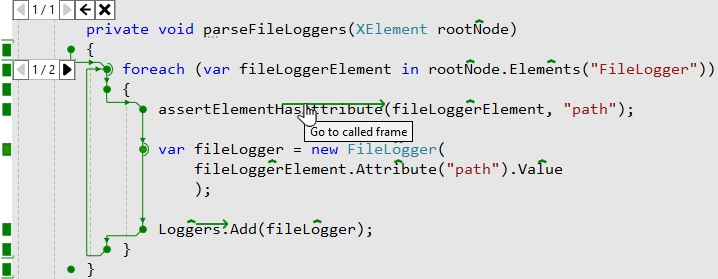
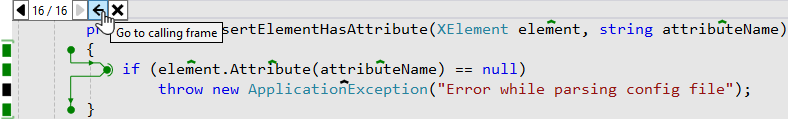
RDI also tracks the flow of control between methods. You can navigate to called methods and back to method callers. It's possible to work backwards from a failure point in your code to examine everything that happened before it, then go sideways into a related area of code that might even be responsible for the failure.
Searching and Filtering
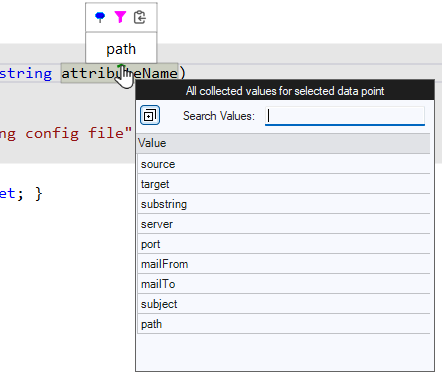
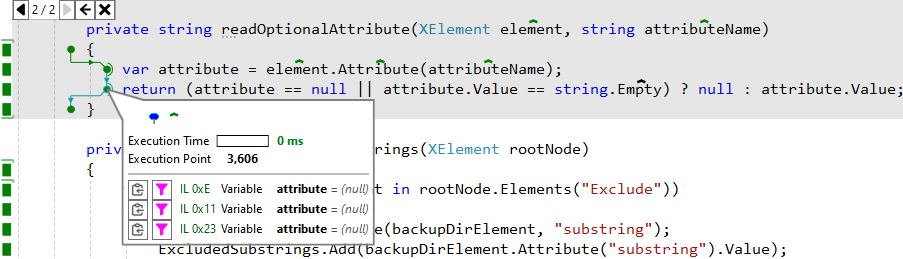
By selecting one of the data point markers in the RDI overlay, you can open a dialog that will show you all collected values for that data point. You can then search through these values and select them as a filter target. RDI will then show only the method frames that contain the filter targets.
Multiple filters can be applied, allowing you to slice your way down through the dataset to just the method calls you are interested in.
Pinning of Data Points and Control Flow Details
The inline popups for data points and control flow markers can be pinned to the UI, making it easy to monitor them while you work.
Performance Tracking
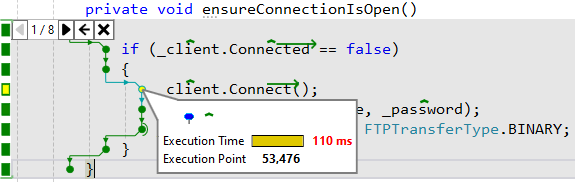
RDI extends NCrunch's existing performance tracking to the control flow markers shown in the RDI overlay. This means you can see how long every statement took to execute.
Distributed Processing Support
RDI is fully integrated with NCrunch's distributed processing features. Grid nodes store RDI data locally and make this available to connected NCrunch clients on request. This is handled transparently in the NCrunch client. In many cases you won't be aware the test was even run remotely.
Image Capture
Some data types can be captured as images. For supported types, RDI will store an image instead of text, and will show this in the overlay when you hover your mouse over the relevant data point.
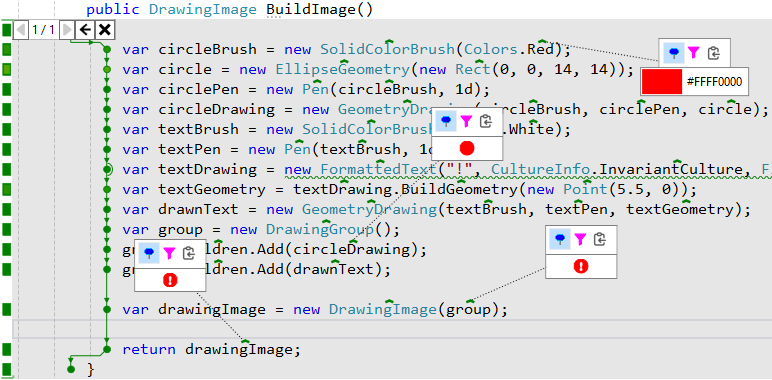
These image popups can be pinned. They can also be searched and used to filter method frames. The impact of this is significant for doing development of UI code covered by tests.
As of NCrunch v5.0, only measured and arranged WPF elements and image types are supported, but we plan to add more in future.
Live Coding with Open Overlays
You can write code with overlays open and data points pinned. NCrunch will automatically re-run the tests in the background and RDI will update the overlay with any data changes detected. This lets you examine the behaviour of your code while you write it in real time.
Multi-Threaded Support
RDI supports multi-threaded tests and won't become unstable if tests are intersecting over collected data points. Every data point value collected is guaranteed to match the actual value encountered by the thread, as it is obtained from the same entry on the CLR's evaluation stack. Troubleshooting race conditions using a debugger is problematic. With RDI, it is not.
If you have a test that fails intermittently, you can use NCrunch's churn mode to run the test until it fails, then use RDI to determine why it failed.
Multi-Process Support
RDI supports multi-process environments under the control of integration tests. If a test starts a background process containing your code, the background process will be included in the RDI session and data from it will be collected. This allows the detailed examination of code running in entire process trees inside RDI overlays.
Async Handling
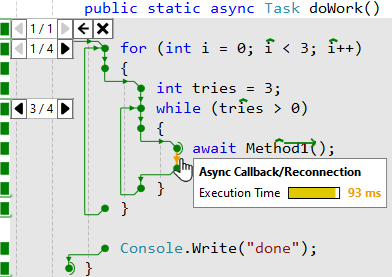
RDI is integrated with async/await and will reconnect methods that have been split by async continuations. The time taken to resume execution is also tracked and reported.
Highly Scalable
Data captured by RDI is carefully indexed and processed to reduce redundancy and maximise efficiency. RDI supports datasets running well into the terabytes and potentially spanning an entire grid of connected servers responsible for test execution.
Extremely Configurable
RDI has a broad range of configuration options and inline overrides that can be used to control it. RDI data collection can be ramped up to aggressively capture as much data as possible, or ramped down to conserve scarce system resources. Settings can be applied through NCrunch's configuration system, applied at test-level using attributes, or even set for specific code regions using inline directives.
Aggregations
Although RDI is generally used to inspect data collected from singular tests (for example, when troubleshooting test failures), it can also aggregate frames across multiple tests.
To open an aggregated set of frames, simply right click on the RDI brackets in the NCrunch coverage bar.
The aggregated frameset consists of all frames from every time the method was called for all tests that cover it. Collected frames will be included in this result set regardless of whether they are stored on the local machine or a remote grid node. Frames that are stored on disconnected grid nodes will be excluded with warnings being shown.
The count of aggregated frames will include frames that couldn't be collected due to RDI data limits. However, any attempt to view these frames will result in an empty overlay with an attached warning.
It's possible to enumerate through the aggregated frames one at a time, but generally the more useful approach is to filter them. Opening up a data point popup will show all collected data values for the selected data point for all covering tests. You can then choose data values to filter the aggregated frames down to the most relevant ones.
The same features apply to aggregated framesets as exist for normal ones (i.e. image capture, stacked filters, etc). Live coding with an open aggregated frameset is also possible though the engine may need to work harder to keep the frameset in alignment with the code.
When navigating away from an aggregated frameset, RDI will automatically switch to opening frames only for the specific test targeted by the navigation.
RDI aggregation is an amazing way to quickly understand how a method is being tested.
Limitations
Although RDI is extremely powerful, this power comes at a cost. RDI involves the collection and storage of potentially massive datasets. Usage of RDI can significantly increase hardware demands, particularly when used on large solutions with many tests.
Disk Space Consumption
RDI stores collected data in large rolling binary logs that are stored on the machine responsible for test execution. To prevent runaway data collection and to keep log sizes under control, RDI strictly enforces a range of configurable data limits that will prevent a solution (or areas of code) from bloating the logs. At times, these data limits can result in requested frames being unavailable in the RDI overlays. Using RDI involves a configurable balance between data availability and conservation of system resources.
A design goal of RDI is to minimise the size of data held inside log files while also minimising the CPU/time required to pack the data in these files. Steps are taken to reduce redundancy in the logs as much as practically possible.
It is possible to split RDI's data storage across multiple disks to improve I/O performance and overall capacity.
Data limits can be controlled for specific projects, specific tests or specific methods.
RDI heavily cycles data though its storage. In high usage scenarios when the NCrunch engine is churning heavily, this may have implications for SSD lifespans. If you are running RDI on a large solution with aggressive settings, it's recommended you do not place a storage path on any drive containing important data.
CPU Consumption and Test Execution Time
RDI's data collection is enabled by instrumenting user code. Instrumentation is not a new feature in NCrunch and already supports all of its existing code coverage and performance tracking features, but the instrumentation for RDI is naturally heavier and has a more significant impact on test performance.
When RDI is enabled, tests may take considerably longer to run and may consume more CPU, especially if data limits are set very high.
Data collection can be deactivated for specific projects, specific tests or specific methods.
Supported Data Types
RDI supports the collection of all primitive .NET types (i.e. int, char, float, string, etc). Value and reference types are captured as string values, which are obtained by calling their ToString method. This makes it possible to customise how types are represented in the RDI overlay.
For the best experience with RDI, it is recommended that you override ToString on all of your core domain types to return informative values.
Presently, RDI does not support the hierarchical collection of all fields underlying a complex type. In future, we intend to add better support for complex types so that their fields and/or properties can also be captured and examined in the RDI overlay without the need for ToString.
By default, RDI will not call any ToString methods that involve a risk of introducing side-effects in code. Unfortunately, reliable identification of side-effects is not simple, so many types will be automatically excluded from detailed collection. When a ToString method is found to be at risk, RDI will simply store the type name instead. This behaviour is controlled by the Restrict ToString Usage to Avoid Side-effects setting and RestrictToStringAttribute.
As soon as you are up and running with RDI, it's recommended to try disabling the ToString restrictions so that RDI can show a better representation of all types used by your codebase.
Presently, arrays and collection types have only their length captured and their contents cannot be interrogated by RDI. We have plans to improve this in future so that collection items are individually captured and can be shown in the RDI overlay.
Data Point Placement
RDI has limitations when placing data points in source lines, particularly when a source line may have the same data point name written multiple times. A more detailed explanation of this problem and why it exists can be found here.
Image Capture Limitations
Currently, RDI can only capture images from WPF elements and image types. Because we rely on WPF's internal rendering, it is not possible to capture images from remote servers without a WPF rendering GUI. This means that image capture currently does not work with distributed processing unless remote servers have a capable video card or open RDP session.
Image capture is a high-cost activity at run time and will have a higher impact on test performance than capture of other data types. It will also contribute to higher disk consumption and cause RDI to reach its data limits sooner.
